Charts provide a mechanism to users to visualize data in a quick and efficient manner right from the home page. There are two different types of charts we offer
| • | Non-interactive image charts which appear right on the home page, |
| • | A menu of Interactive charts which can be accessed on the right side bar. |
These charts are not interactive and are meant to give a very quick summary of data. As of our current release, they include:
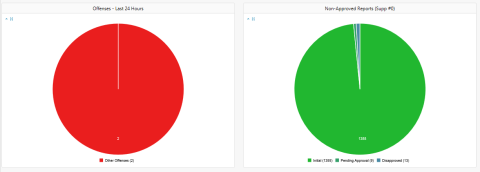
| • | Offenses - Last 24 Hours- This is a pie chart which summarizes offense in the last 24 hours. The offenses are grouped according to their NIBRS codes to offer simple categories such as larceny, assault, etc... Note that this chart's functionality is expanded in the interactive charts Offense Activity and Snap Shot, which are described below. |
| • | Non-Approved Reports - This pie chart shows counts of all initial incident reports (Supp 0) which are not approved (i.e. either in initial status, pending approval, or disapproved). A more interactive version is available in the interactive charts, described below. |
Above is an example of how the image charts are shown on the Online RMS home page
Interactive Charts are accessible from the right side bar of the home screen. Look for the section labeled Charts.
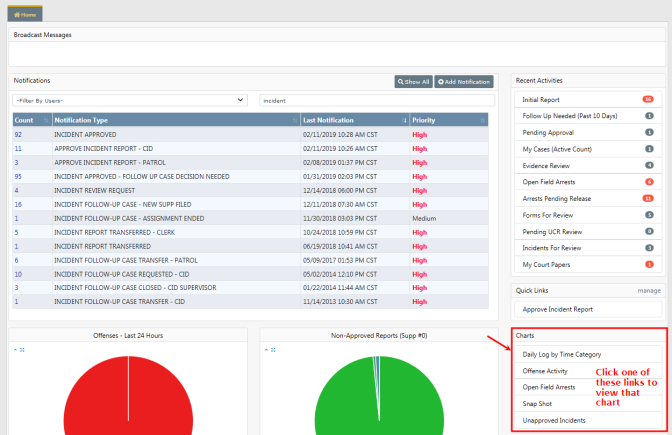
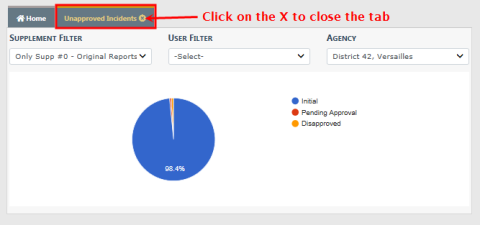
When you click on a chart link, a new tab opens on the home page to display that chart. Click on the X to close the tab.
Some charts have controls such as date ranges to allow you to customize the data you want to see.
Various Interactive Charts are available.
| • | Daily Log by Time Category |
| • | Offense Activity |
| • | Open Field Arrests |
| • | Snap Shot |
| • | Unapproved Incidents |
| • | Calls for Service |
This chart displays offenses, by count, for various date ranges, and even allows you to display offense counts based on the time of day. The Select a Display select box allows you to choose what date range you want for visualizing data. It will either display a daily or monthly view depending on which range is selected. For example, the week to date option would show a daily view; however month to date & last month has far too many days to make sense on a graph, so it is shown in a monthly view.
You can also select Show Results by Time of Day to change the display to group offenses based on the time of day the occurred. The time of day is split up into four hour intervals starting from midnight.
The Agency filter is available for multi-tiered agencies to view events at the top organization level for all agencies, or an individual agency beneath the parent organization.
Regardless of the display you select, results will be shown in color coded Stacks, with a legend at the bottom indicating what colors represent what offenses. You can hover the mouse over a particular section to show the offense type & count, and you can click on a section to bring up a list of actual Incident Reports containing those offenses on that date / time.
When viewing the incidents, you can click on the Quick Tab icon in the Actions column to open another tab which will give you a summary for that Incident Report. This is similar to the Incident Summary Page, but is presented in a view-only manner to give you quick access to the report.
This bar chart identifies Arrests that are in Open or Pending Review status.
As a Officer Supervisor you can open the Field Arrest Chart and drill down to the details to either approve or disapprove the Field Arrests.
Hover your mouse over the blue boxes to see a total count, and click the blue boxes to display details of those counts in the bottom grid.
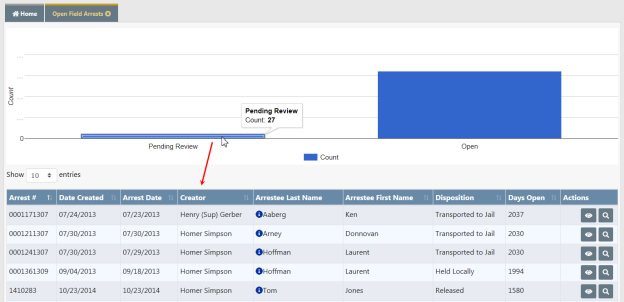
Click on the icons to the right to view  or review
  an entry in the bottom grid. If an icon does not display, then you do not have access to that function.
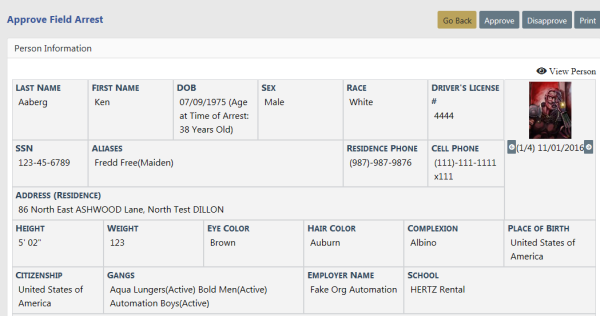
| • | The View icon opens the View Field Arrest form. For more information on the disapproval process refer to ApproveDisapproveFieldArrest.htm |
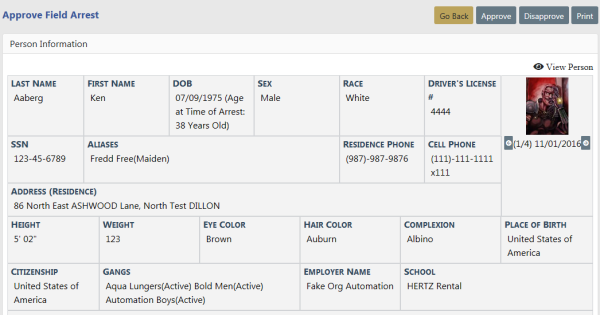
| • | The Review icon opens the Approve Field Arrest form, where you can Approve, Disapprove, or Print the Field Arrest. For more information on the approval process refer to ApproveDisapproveFieldArrest.htm. |
This is a by-the-numbers chart which varies based on what features your agency has access to. Currently it contains the following:
| • | A count of offenses. |
| • | A count of citations based on the citation type. |
| • | A map showing incident data. |
This chart has a Select a Display option which allows you to select different date ranges. It is different from other charts in the date range options it presents, as it is only meant to display very recent data.
This is a more interactive version of the Non-Approved Reports chart featured on the home page. It gives you the option to display only initial incident reports (supplement 0) which are currently not approved (Initial, Disapproved, or Pending Approval), or all supplements not approved. You can click on a section of the chart to bring up a list of the incidents that fall under the category you clicked. You can then use the Quick Tab icon in the Actions column to view the details of the report.
You can view CFS event imported from CAD or directly entered via the Online RMS module. The chart provides awareness of activities for shift briefings. Time ranges allow users to view events from a prior shift or particular time frame. Geo-coded events are available for plotting on a map display. You can filter by agency and user groups.