The Crime Visualization Tool that generates the Spider Chart is accessible from various pages of Online RMS such as Incident Summary, Persons, etc., by clicking on the Visualization Tool button or other method, depending on the Online RMS page. For more information on accessing the Crime Visualization Tool refer to Access Points.
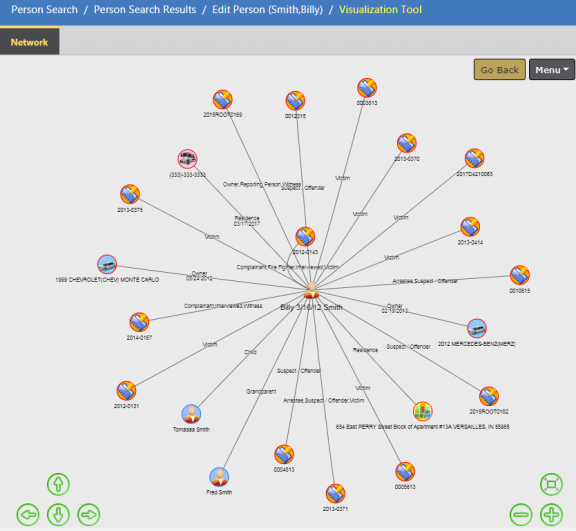
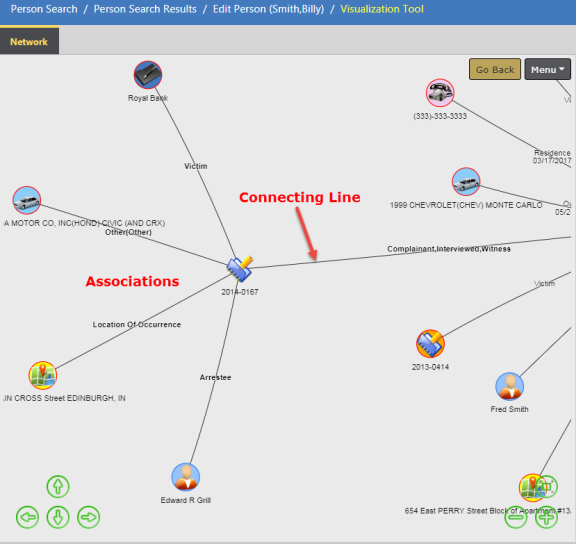
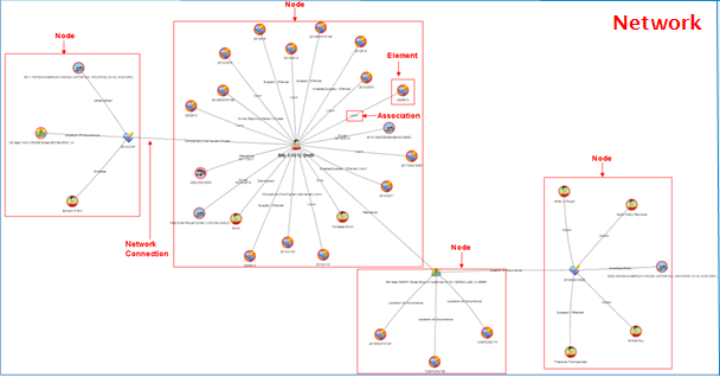
Below is an example of a Spider Chart generated from the Edit Person page for Billy Smith. Billy Smith appears in the center of the chart with connecting lines to each association, also known as Element.
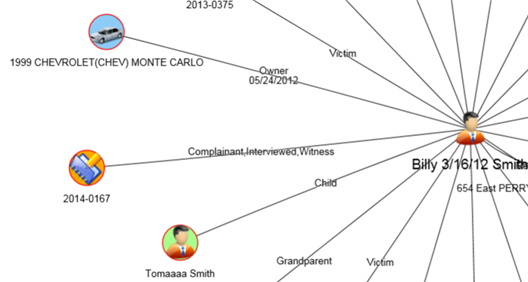
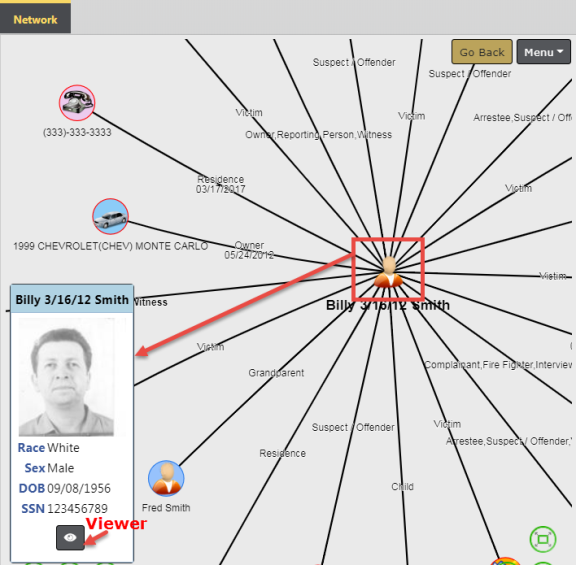
A closer view of the same chart shows the associated label to each Element, such as Grandparent, Victim, Child, etc.
Click on an Element to open a box containing links to either view the data in a new tab, or include all associations to that Element on the Spider Chart.
Note: Double Click on an Element to immediately open all associations to that Element on the Spider Chartwithout displaying the box.
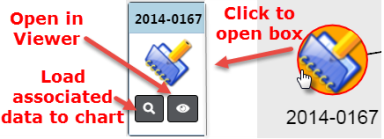
Open in Viewer
Load Associated Data
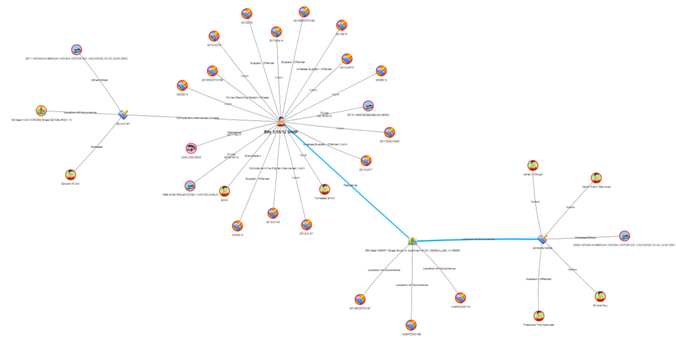
Open and expand associations to multiple Elements, and at multiple levels.
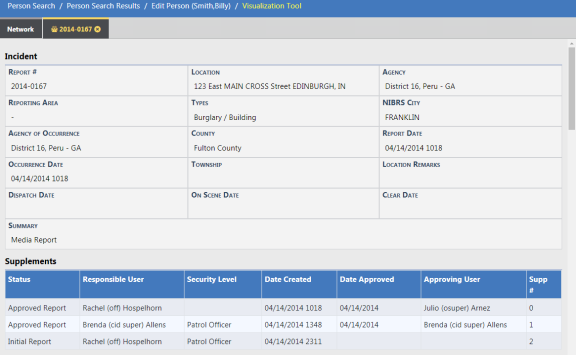
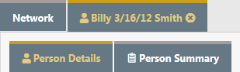
The record from which you accessed the Crime Visualization Tool displays as the center Element in the Spider Chart. The above chart generated from Persons for Billy Smith. Click on the Billy Smith Element to display a box with a link to additional information, then click Open in Viewer to display details of Bill Smith in a new tab.
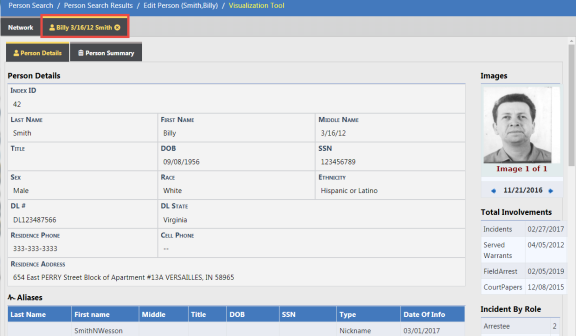
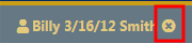
Click the X on the right side of the tab to close.
Click on the Person Details or Person Summary sub-tabs to view details of the associations, or a summary.
The Spider Chart consists of several components:
| • | Network |
| - | A visual representation of the entire collection of nodes, elements and associations, and how they interrelate. |
| • | Node |
| - | Collection of elements and their association to one another. |
| • | Element |
| - | The representation of specific people, places, things or events. |
| • | Association |
| - | A line with description showing how elements are associated with one another. |
| • | Network Connection |
| - | A line that represents the connection between Nodes within the Network. |
You can re-size the chart by using the mouse, keyboard, or the resizing icons.
Click anywhere on the chart then move the mouse wheel away from you to enlarge the image on the screen, or move the mouse wheel toward you to decrease the size of the image.
Press the Ctrl and + (plus sign) keys simultaneously to enlarge the image, or press the Ctrl and - (minus sign) keys to decrease the size.
The resizing icons allow you to easily zoom in, zoom out, re-center, or move the visualization up, down, left or right.
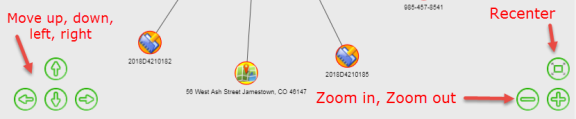
Click anywhere on the chart then drag to a new location on the screen.
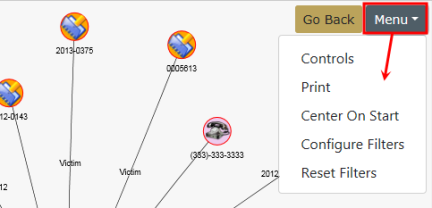
Click on the Menu button on the top right to re-center the chart and include or exclude filters, print, and set controls.
| • | Re-centers the Network display on the screen. |
Configure Filters
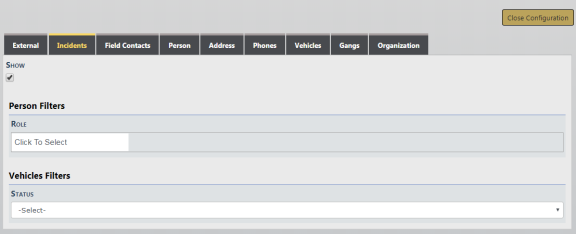
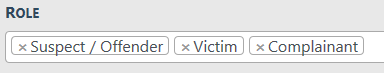
| • | Select one or multiple roles from the list. To remove a chosen role, click on the X. |
| • | Select one status from the list |
| • | Click Close Configuration to apply the Filters. |
Note: Filters are reciprocal, which means if you filter the incident category using person details, it also filters on the person category of the associated incidents.
Reset Filters
| • | Clears any Filters applied and redraws the chart. |